lab
This procedure is part of a lab that teaches you how to monitor your Kubernetes cluster with Pixie.
Each procedure in the lab builds upon the last, so make sure you've completed the last procedure, Instrument your cluster, before starting this one.
Until now, you've been working with application services that don't have bugs (we hope). You've been able to access TinyHat.me and render Bob Ross with one or more silly hats without a hitch. But it's time to deploy some new code to your cluster.
Change to the scenario-1 directory and set up your environment:
$cd ../scenario-1$./setup.shPlease wait while we update your lab environment.deployment.apps/fetch-service configureddeployment.apps/simulator configuredDone!Important
If you're a windows user, run the PowerShell setup script:
$.\setup.ps1Uh oh! You look on social media and see some confused customers:
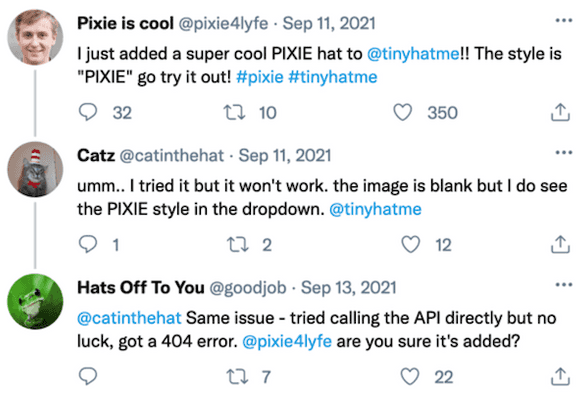
What's wrong with TinyHat.me? Use Pixie to find out.
Reproduce the issue
You've been notified by your users that they can't see a particular hat on TinyHat.me. Before you start debugging your code, reproduce the issue for yourself.
Look up your frontend's external IP address:
$kubectl get servicesNAME TYPE CLUSTER-IP EXTERNAL-IP PORT(S) AGEadd-service ClusterIP 10.109.114.34 <none> 80/TCP 20madmin-service ClusterIP 10.110.29.145 <none> 80/TCP 20mfetch-service ClusterIP 10.104.224.242 <none> 80/TCP 20mfrontend-service LoadBalancer 10.102.82.89 10.102.82.89 80:32161/TCP 20mgateway-service LoadBalancer 10.101.237.225 10.101.237.225 80:32469/TCP 20mkubernetes ClusterIP 10.96.0.1 <none> 443/TCP 20mmanipulation-service ClusterIP 10.107.23.237 <none> 80/TCP 20mmoderate-service ClusterIP 10.105.207.153 <none> 80/TCP 20mmysql ClusterIP 10.97.194.23 <none> 3306/TCP 20mupload-service ClusterIP 10.108.113.235 <none> 80/TCP 20mPaste the IP in your browser:
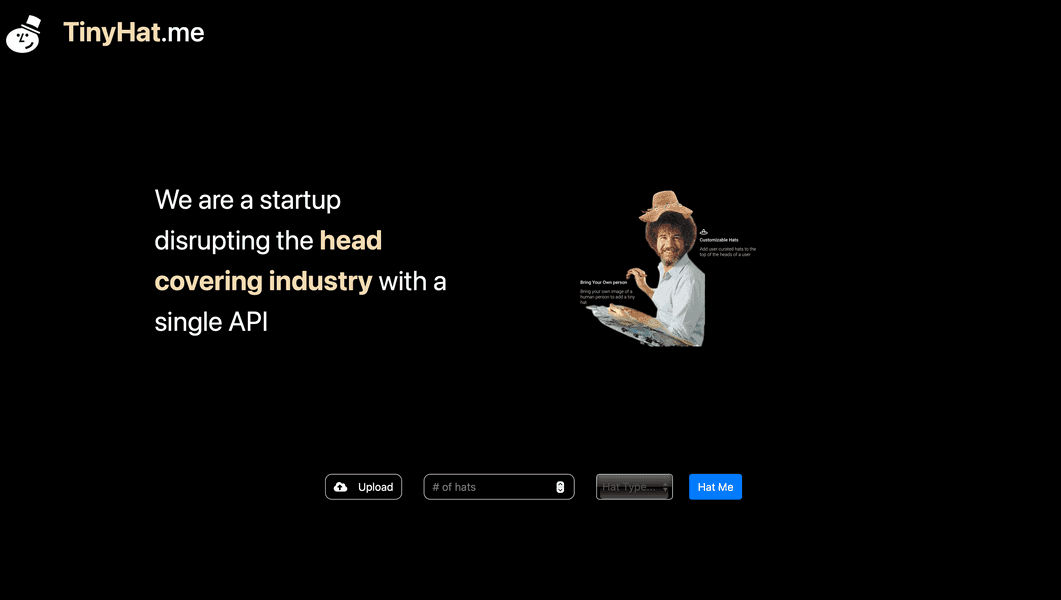
This looks the same as it did before, except that there's a new hat style, called PIXIE.
Select a number of hats, the PIXIE style, and Hat me:
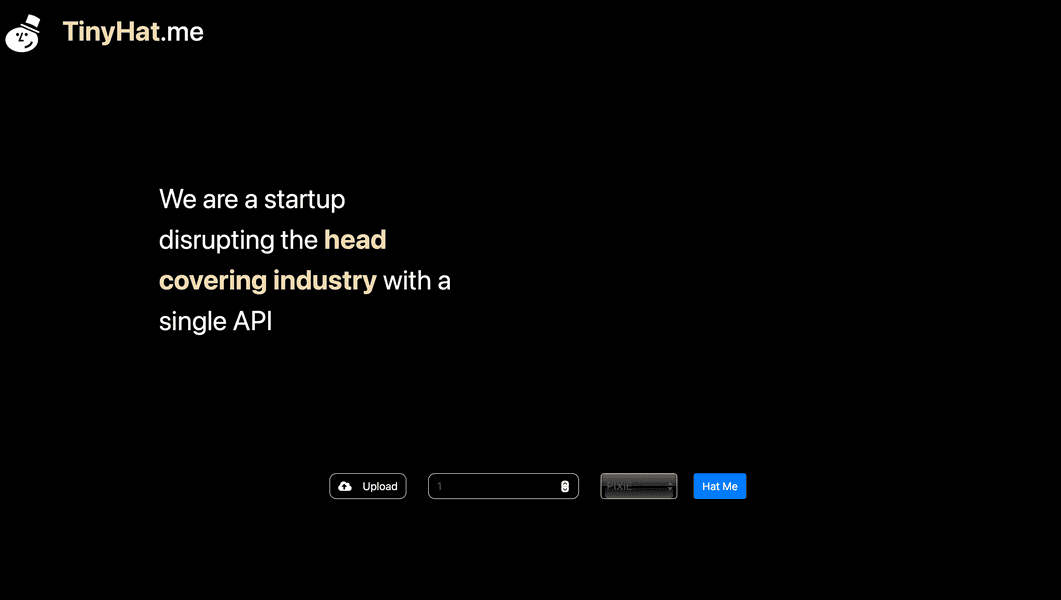
Oops! Where did Bob go? Instead of rendering Bob Ross with your hat selection, the frontend served no image at all.
Tip
The number of hats you choose to display has no effect on the result.
Observe a network request in your browser's developer tools:
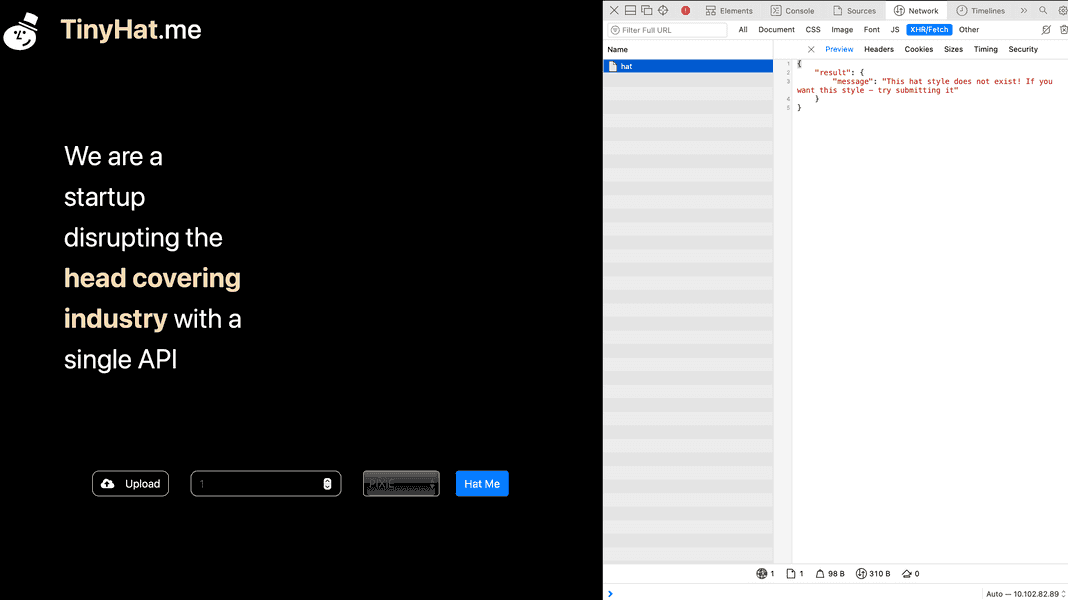
Here, the response from the image request says, "This hat style does not exist! If you want this style - try submitting it."
You know that the PIXIE hat style most certainly does exist because you chose it from the selector. But for some reason, the application can't render the image.
For good measure, try to render a different hat style:
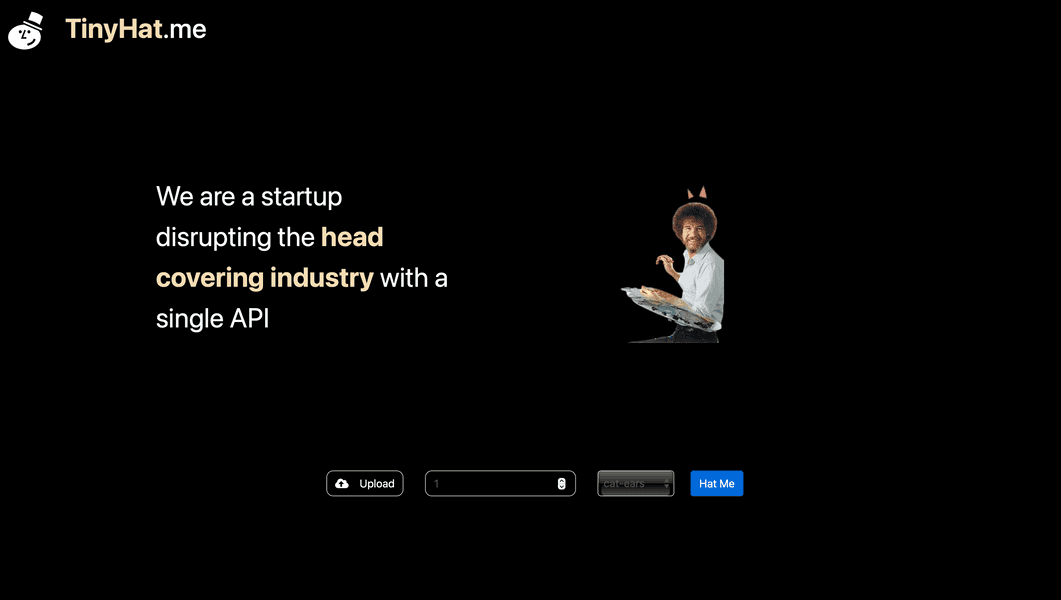
It worked! Your users were right. There's something wrong with your application.
Solve the mystery with Pixie
The bad news is that you've confirmed there's an error in your application. The good news is that you recently instrumented your cluster with Pixie! Go to New Relic and sign into your account, if you haven't already.
From the New Relic homepage, go to Kubernetes:
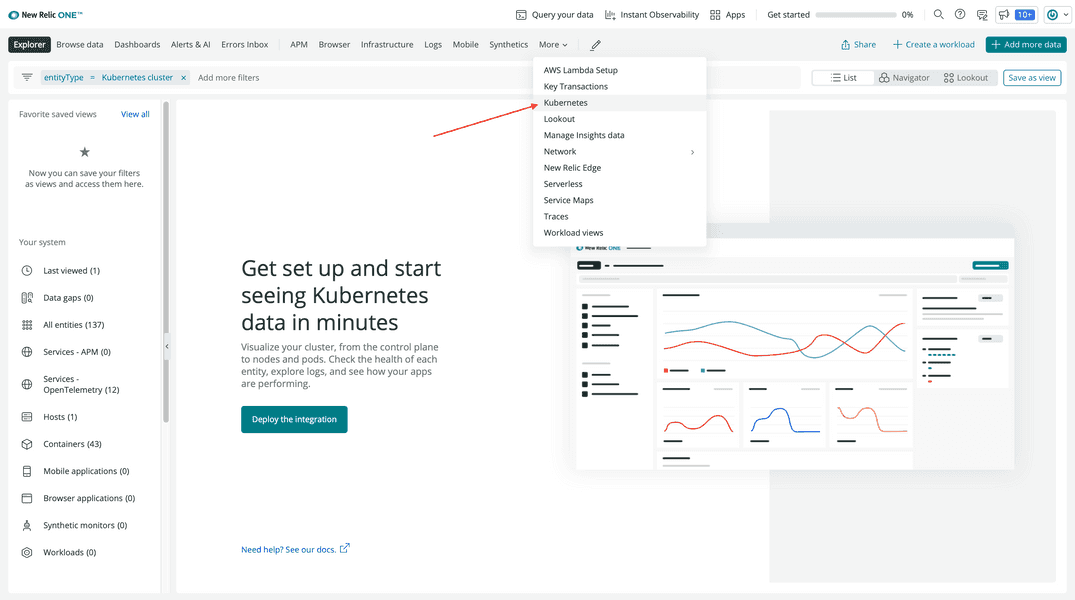
Choose your tiny-hat cluster:
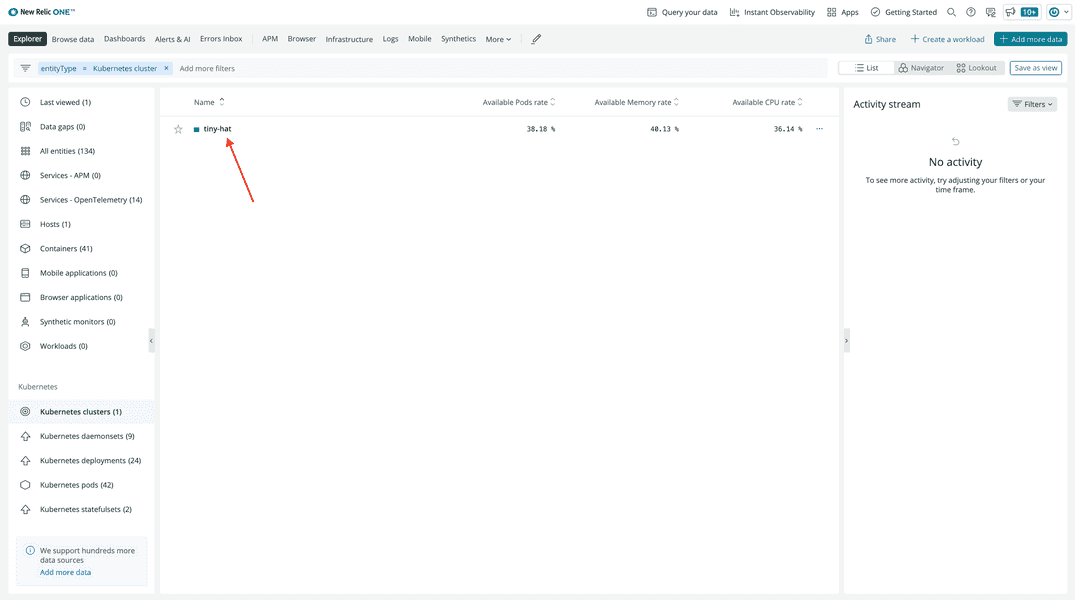
Then click Live Debugging with Pixie:
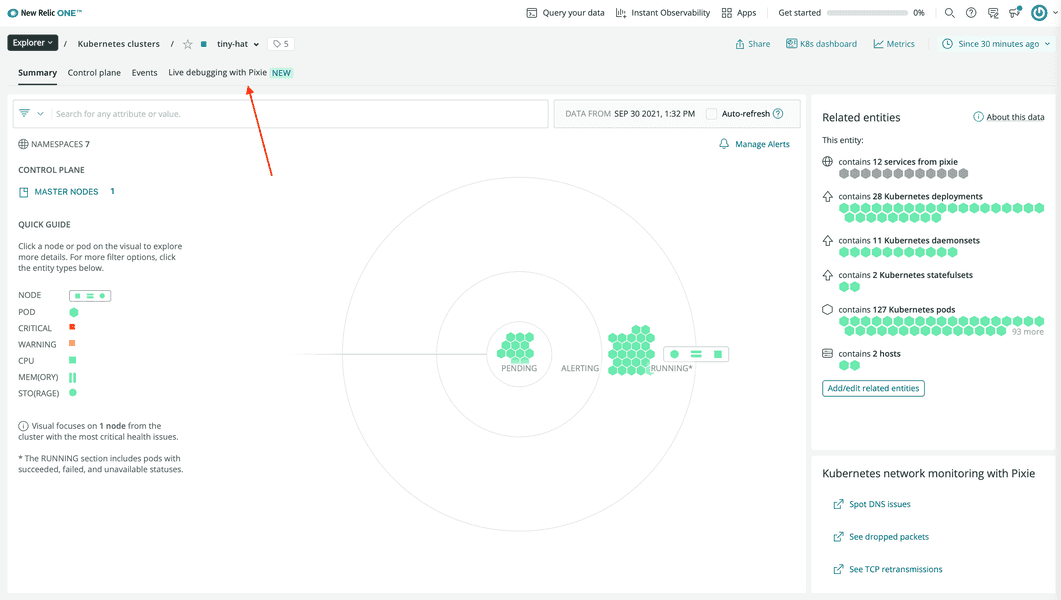
This is Pixie's live, code-level debugger:
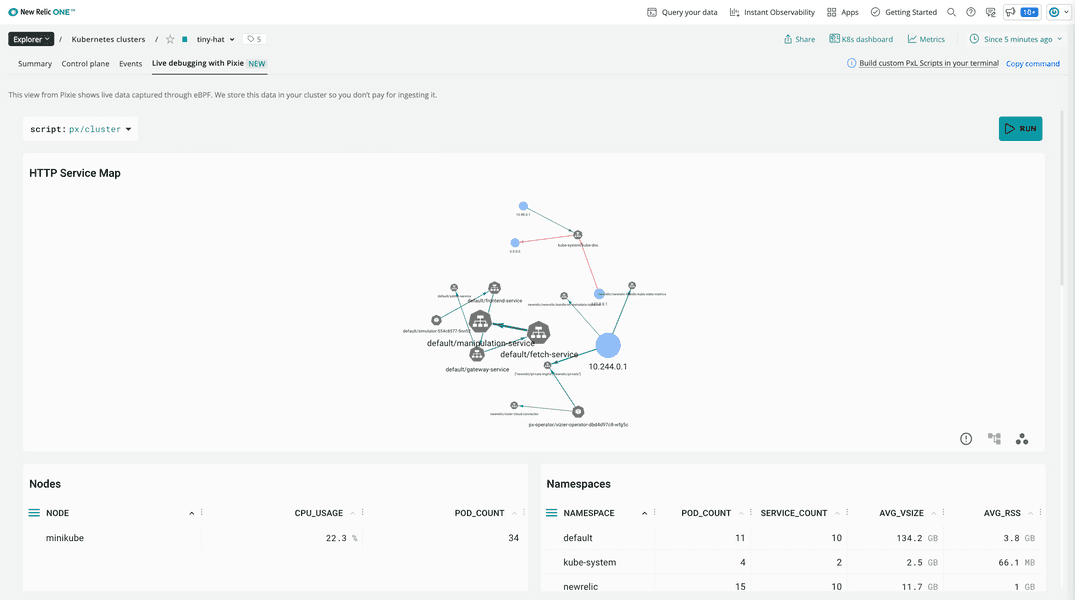
You use it to drill down and learn more about the services in your cluster.
Important
When you go to the live debugger, you may see an error saying your cluster is disconnected. This is normal, as it takes a little while for New Relic to start seeing your Pixie data. Wait a few more minutes and refresh the debugger.
Notice the script dropdown menu at the top of the debugger:
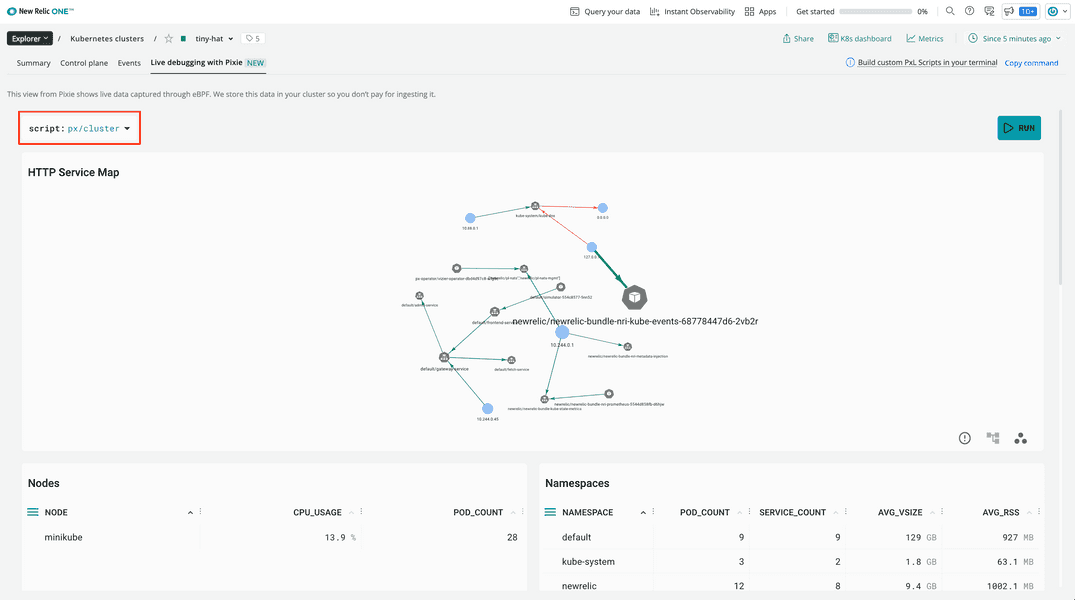
Pixie's live debugger renders data based on open source scripts written in PxL, Pixie's proprietary query language. The default script is px/cluster, which shows cluster-level information including:
- A service map
- Nodes
- Namespaces
- Services
- Pods
Scroll down to see the error rates for your services:
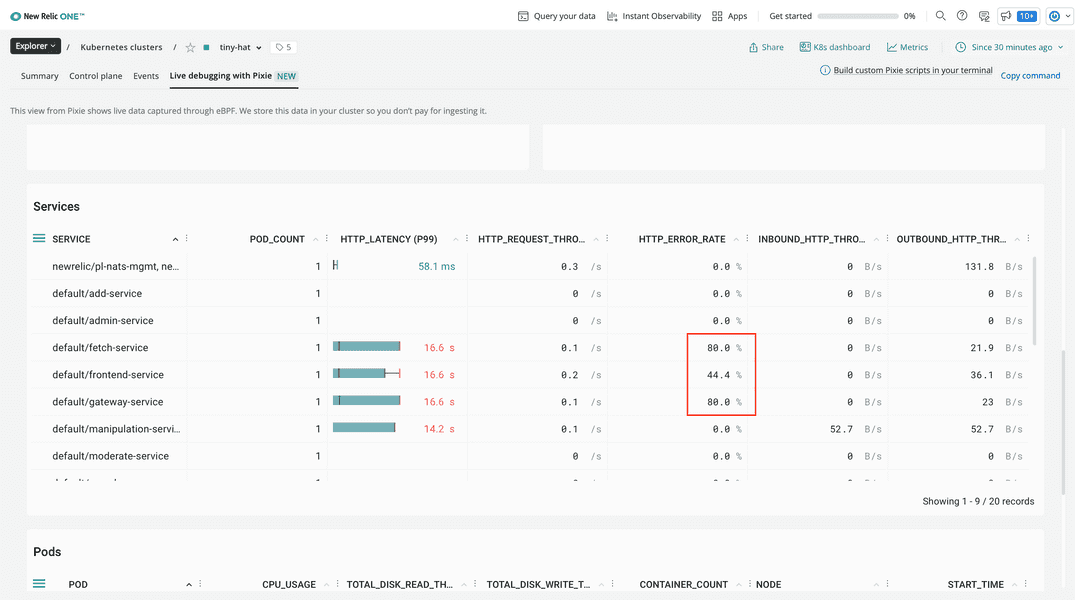
Yikes! You have three services returning a high percentage of errors:
- fetch-service
- frontend-service
- gateway-service
You know that the website lives at frontend-service. You can reasonably rule this out as the culprit because you know it renders other hats just fine. That leaves two potential problem services:
gateway-servicefetch-service
To decide which service to look at first, scroll up to NAMESPACES and choose default:
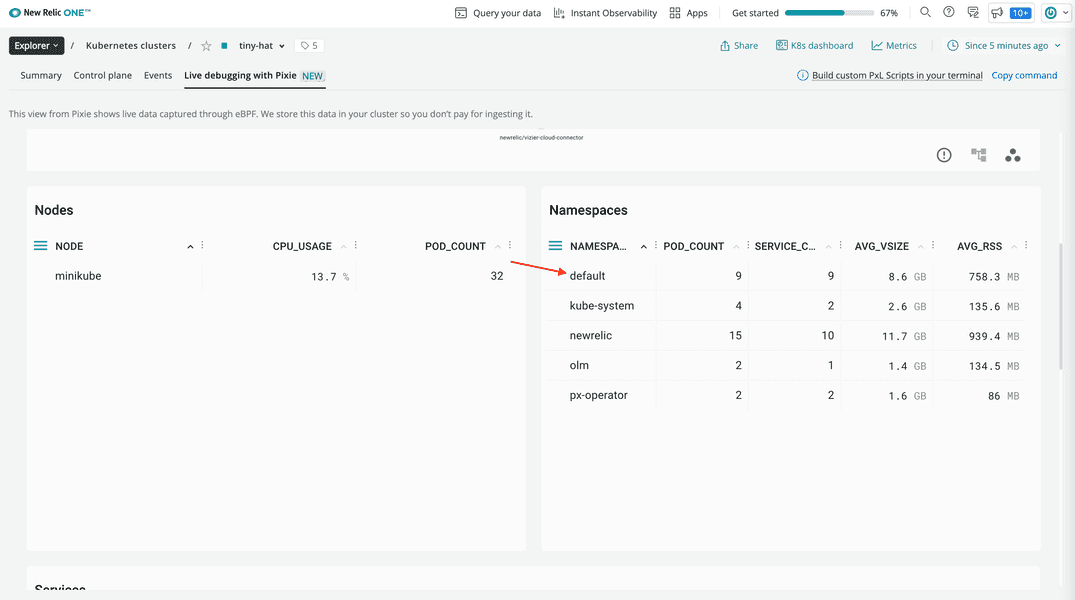
Your app services live in the default namespace. This helps you filter the service map to show more useful nodes.
Scroll up to the service map:
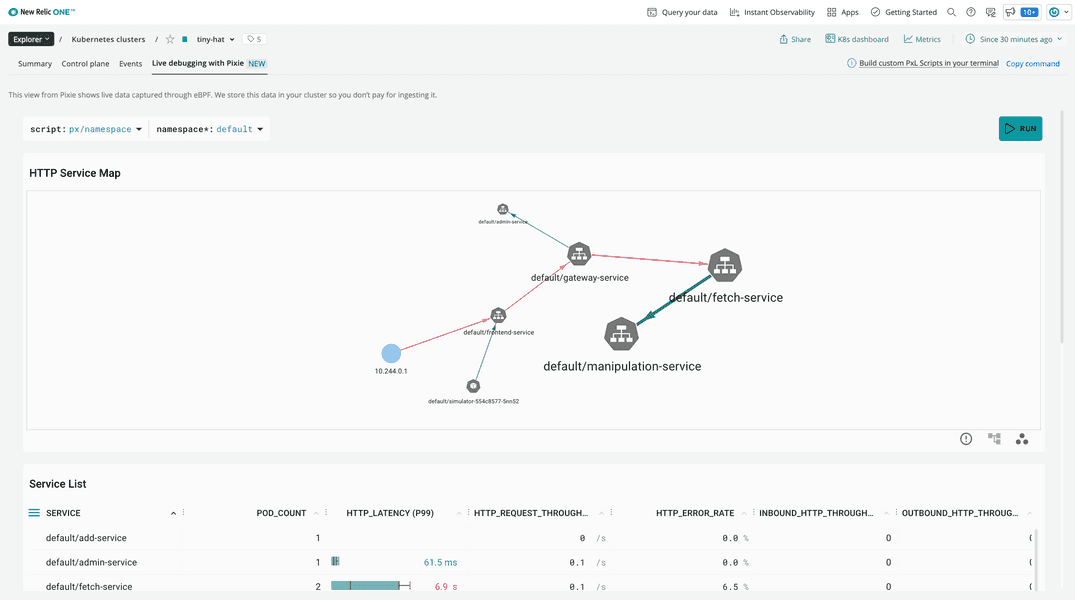
Here, you see that the frontend-service requests data from gateway-service. In turn, gateway-service requests data from fetch-service. So, following that order of operations, focus first on the gateway-service.
Tip
You can click and drag the nodes in the service map to make it more readable.
Double click the gateway-service in your service map to learn more about it:
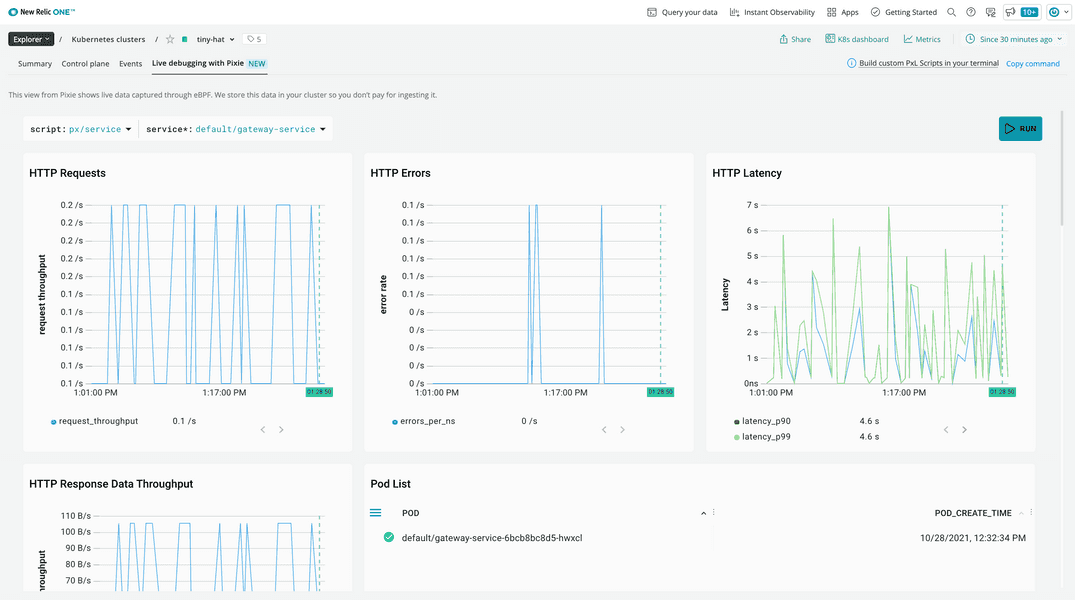
Notice that Pixie's live debugger has seamlessly replaced namespace data with service data by changing the script:
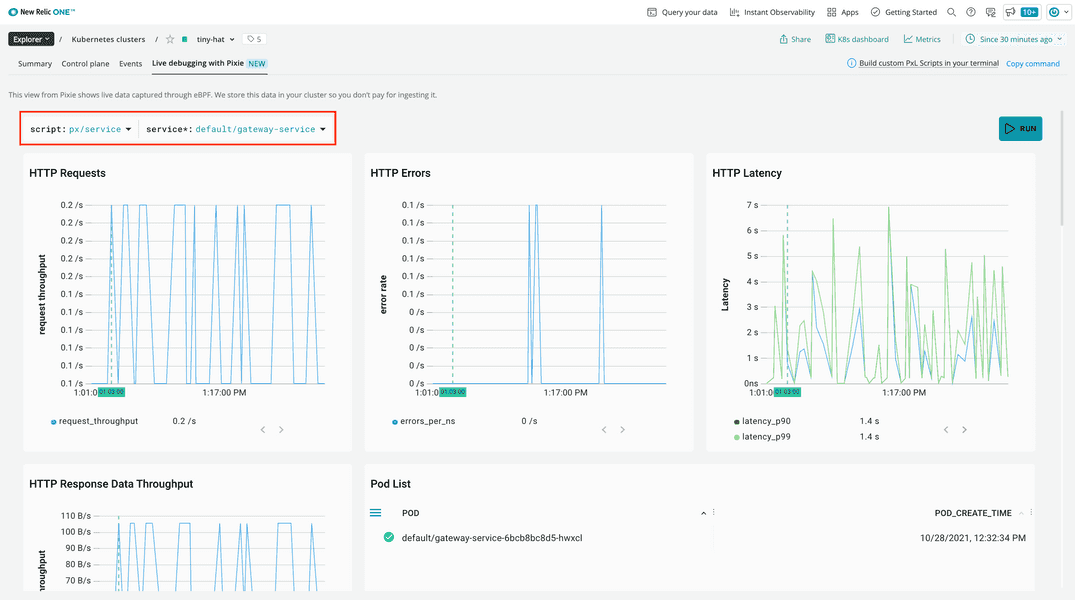
You're now using the px/service script filtered down to default/gateway-service. In this service, you see a graph with the errors, but not much about where those errors are coming from.
Click the script selector to switch to the px/service_stats script. Filter the svc to default/gateway-service:
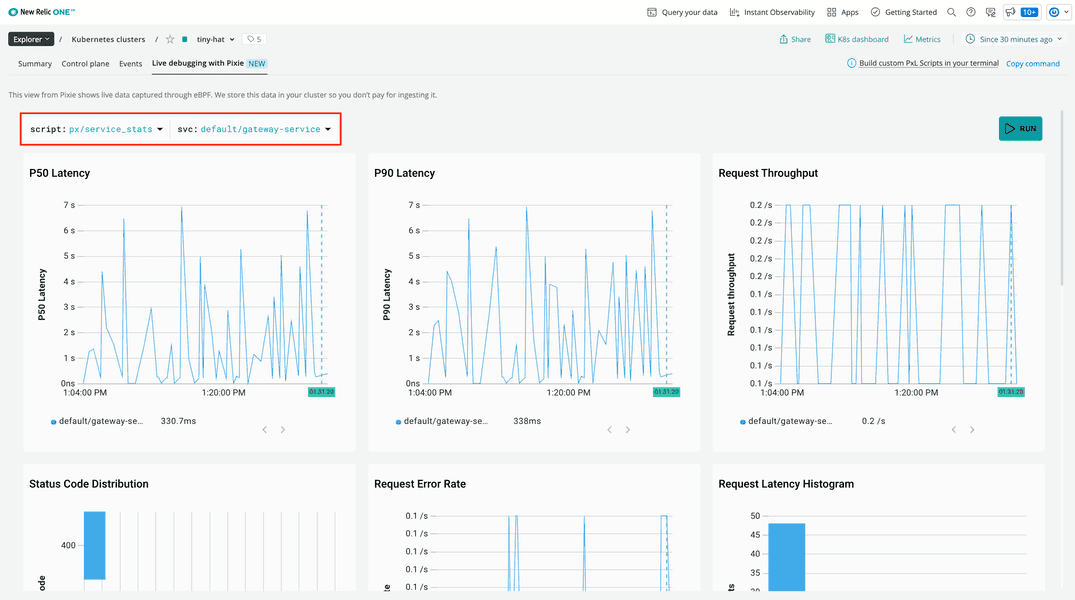
This gives a better picture of the errors in your service.
Scroll down to the Incoming Traffic and Outgoing Traffic tables:
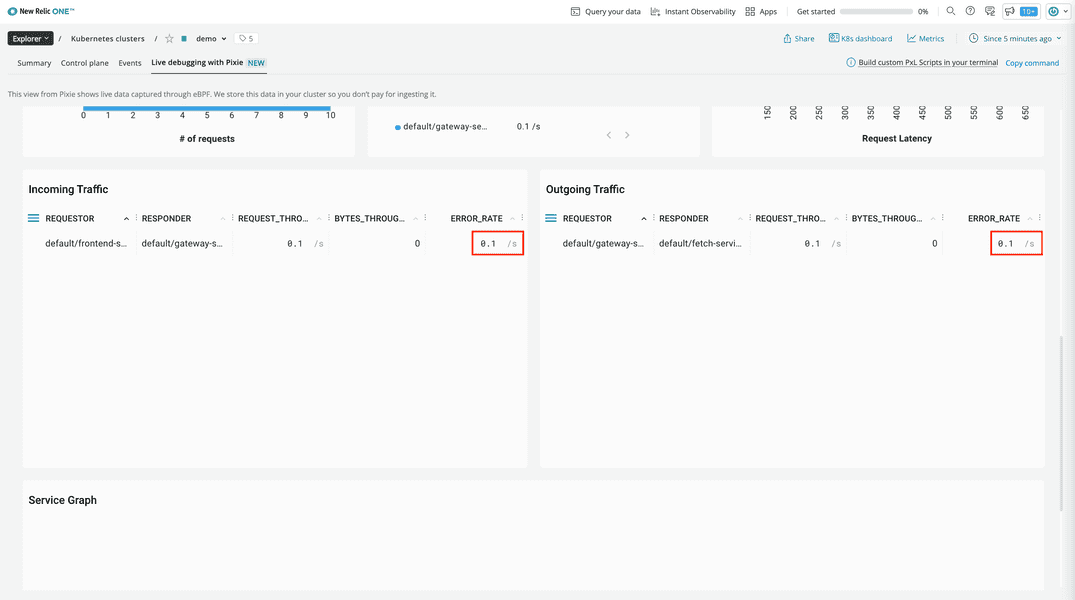
The gateway service is returning the same amount of errors on inbound requests as it's receiving from outbound requests to the fetch service. This is a good indicator that you need to look at what's happening upstream.
Switch to the px/http_data_filtered script, targeting default/fetch-service and requests with a 400 response status code:
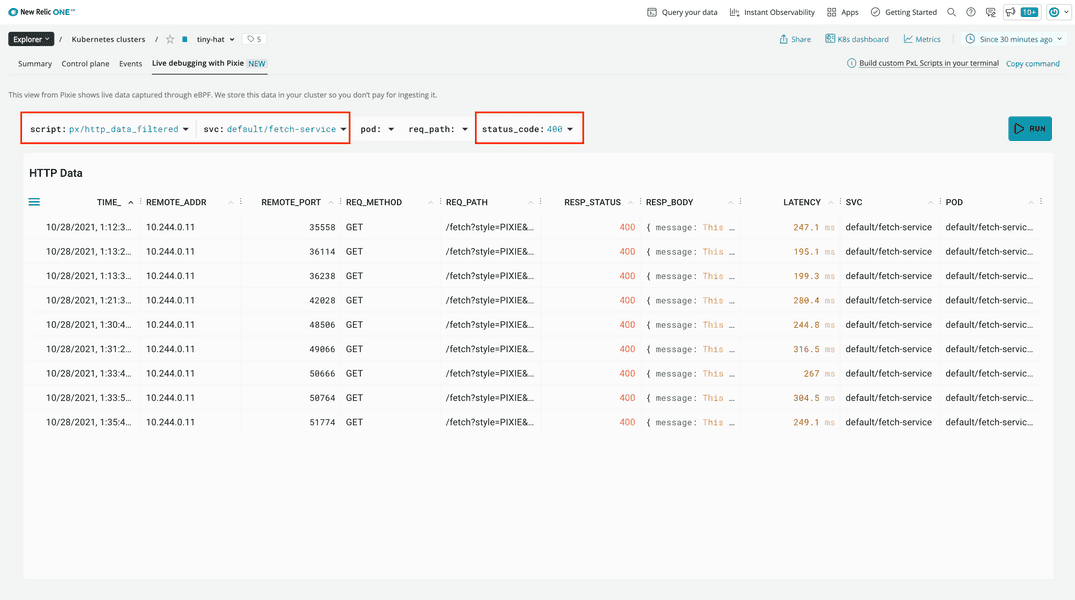
Click on a row to learn more about a request to the fetch service that resulted in an error:
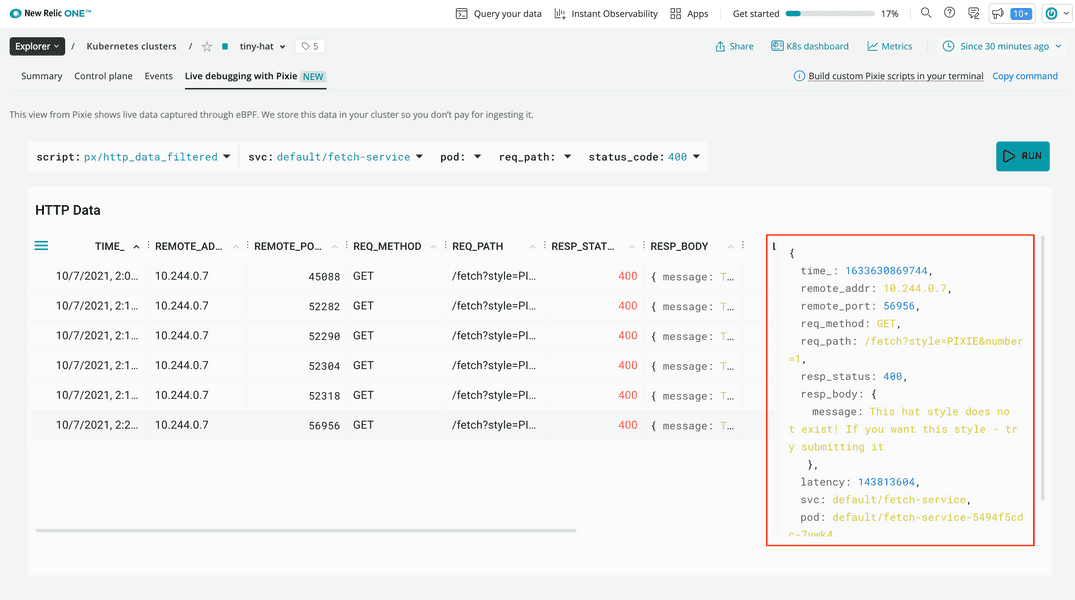
Here, you see that the request path looks like /fetch?style=PIXIE&number=1. This looks right, because the hat style you chose is called PIXIE. So if the fetch service is still returning 400s, something wrong is happening when it tries to find the hat.
Switch to the px/mysql_data script and add a source filter for default/fetch-service:
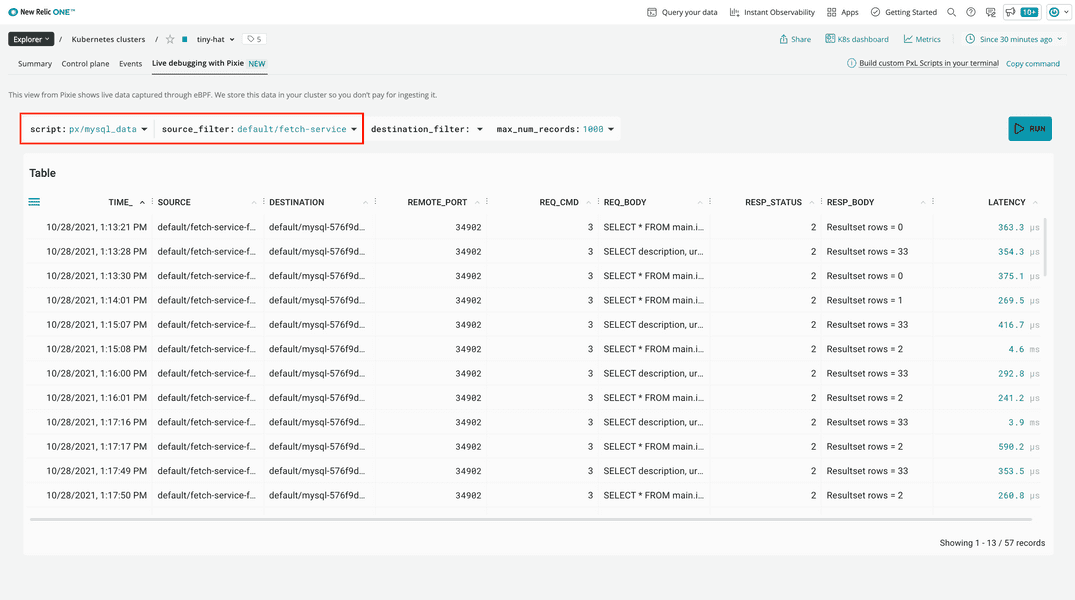
Many of these queries returned no results.
Click on one with no results, and look at the req_body to see the query:
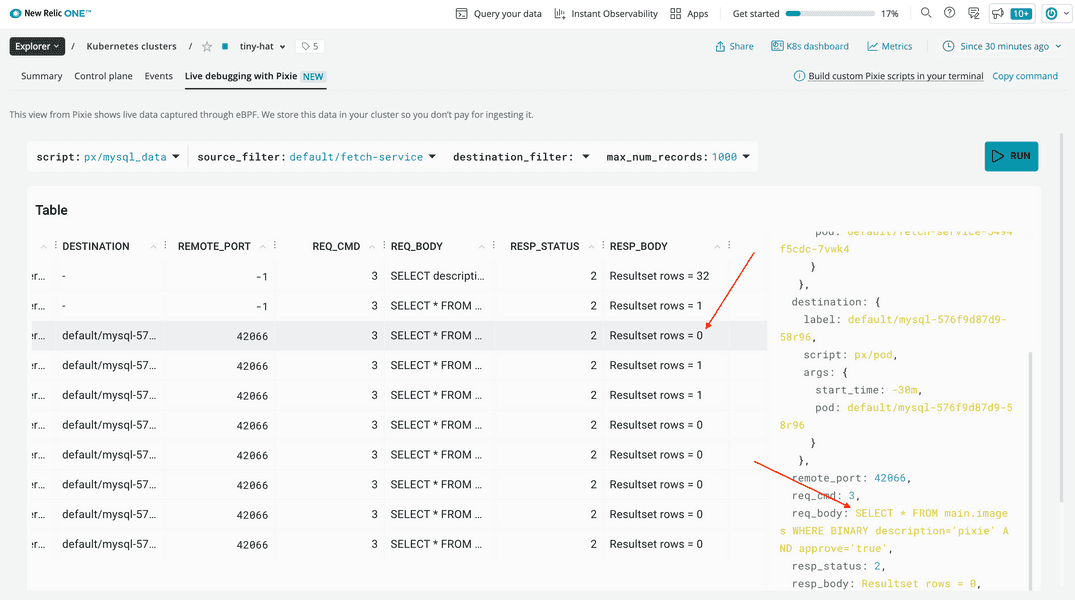
SELECT * FROM main.images WHERE BINARY description='pixie' AND approve='true'There's the problem! The BINARY type cast effectively makes the WHERE condition case sensitive. Since the hat's style is called PIXIE, this condition fails to find it. Now that you know, you can fix this query in your fetch service.
Summary
To recap, you observed an error in your application and used Pixie in New Relic to:
- Understand your services' relationships
- Review the error percentages for each of your services
- Look at individual response bodies
- Find a semantic error in a query within one of those services
And you didn't even need to individually install agents in any of your services. Pixie was able to deliver all the information you needed!
lab
This lesson is part of a lab that teaches you how to monitor your Kubernetes cluster with Pixie. Next, try to figure out why some APIs have high latency.